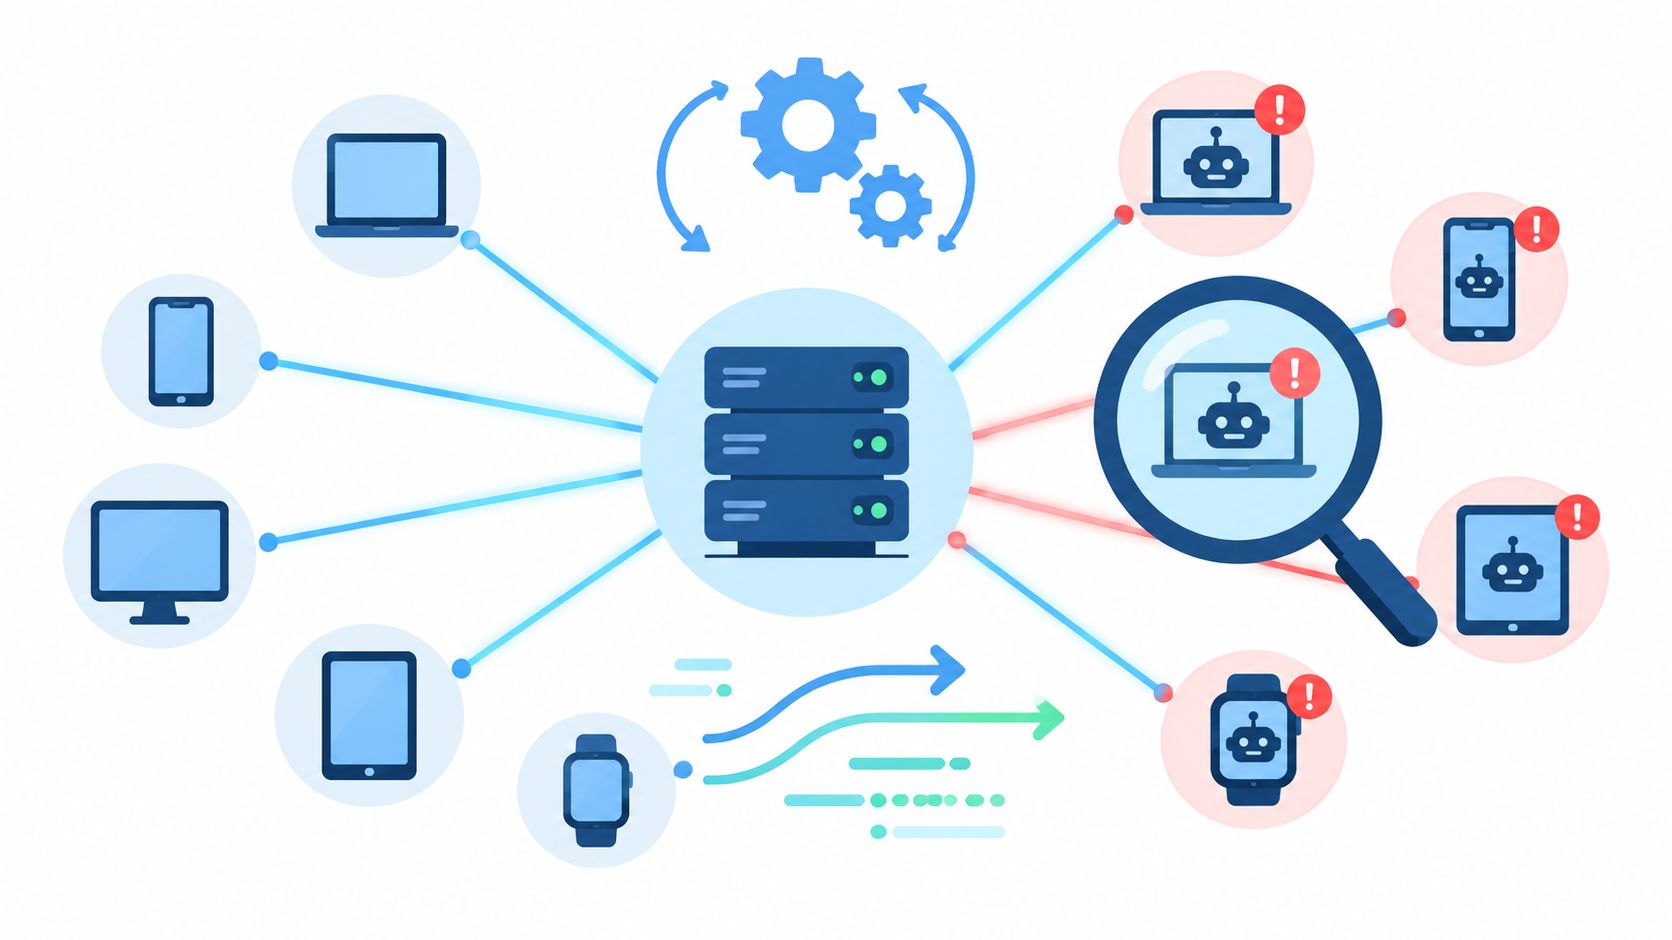
If your login traffic is encrypted, your endpoints are spread across cloud services, and your visitors use residential networks, how do you detect botnet activity without decrypting every request or blocking legitimate users?
The practical answer isn't a single classifier, IP blocklist, or firewall rule. You need to connect DNS behavior, flow metadata, application activity, and browser verification. Botnets often reveal themselves through coordination, timing, domain churn, failed lookups, and repeated automation patterns even when their payloads remain hidden.
That distinction matters for teams protecting signups, logins, checkouts, ticket purchases, and account recovery. A clean residential IP doesn't prove that a session is legitimate, and a suspicious DNS lookup doesn't prove that a device is compromised. Detection should create confidence from several independent signals, then enforcement should follow only after the likely business impact is understood.
Table of Contents
- Why Traditional Defenses Miss Botnets
- Collecting the Right Telemetry Signals
- Correlating Indicators for Detection
- Tooling and Automation Strategies
- Integrating Invisible Browser Verification
- Key Takeaways for Security Teams
Why Traditional Defenses Miss Botnets
Static IP blocklists and signature-based WAF rules miss botnets that spread activity across residential proxies, cloud hosts, and compromised devices that still look clean on paper. A valid-looking login from a familiar browser profile can still be automated. A low-reputation IP can still belong to a real user. If detection stops at request signatures or reputation feeds, attackers get room to operate in the gap between network appearance and application intent.
Practical rule: Treat reputation as context, not identity.
That gap exists because a botnet is not just bad traffic from one source. It is a coordinated set of devices making outbound connections, resolving infrastructure, retrying commands, and executing tasks such as credential testing, scraping, or abuse. The browser request you see at the edge is only the last visible step. The harder problem is linking that request back to the infrastructure behavior that produced it.
Start with visibility, not blocking
DNS often exposes that behavior earlier than the application layer does. In the DNS botnet analysis study, researchers analyzing one hour of DNS traffic from an ISP network identified tens of botnets, each tied to tens of malicious domains, by connecting shared client queries, reputation, and sequential DNS behavior. That matters in practice because botnets rotate domains and command infrastructure faster than static defenses adapt.
The operational takeaway is simple. Track relationships, not just names on a denylist. Useful signals include which clients query the same domains, how often lookups recur, whether timing is bursty or periodic, how domains change over time, and how often resolution fails. Teams that only watch for known malicious domains usually catch yesterday's infrastructure and miss today's replacement.
Encrypted traffic changes the evidence
Encryption removes payload inspection, but it does not erase coordination. Flow timing, destination churn, unusual DNS patterns, session cadence, and synchronized behavior across hosts still leave traces. Recent encrypted traffic research points to the same operational problem defenders run into every day: encrypted channels, protocol obfuscation, and random padding reduce visibility, yet recurring command-and-control behavior can still surface in metadata.
This is the blind spot that traditional controls handle poorly. A firewall can block a known bad destination. A WAF can match a known request pattern. Neither one proves whether a browser session represents a human completing a high-value action or an automated client routed through infrastructure that looks normal enough to pass.
Periodicity alone is weak evidence. Software updates, mobile apps, telemetry agents, and scheduled jobs also produce regular connections, and malware can add jitter to avoid obvious timing signatures. The reliable approach is correlation. When a device shows unusual DNS behavior, then produces similar encrypted flows, then triggers suspicious login or signup patterns, confidence goes up. When a browser verification layer such as MANDATE shows proof of a real browser for the same action, analysts can separate noisy infrastructure signals from sessions that actually threaten account recovery, checkout, or login flows without falling back to CAPTCHA on every edge case.
Collecting the Right Telemetry Signals
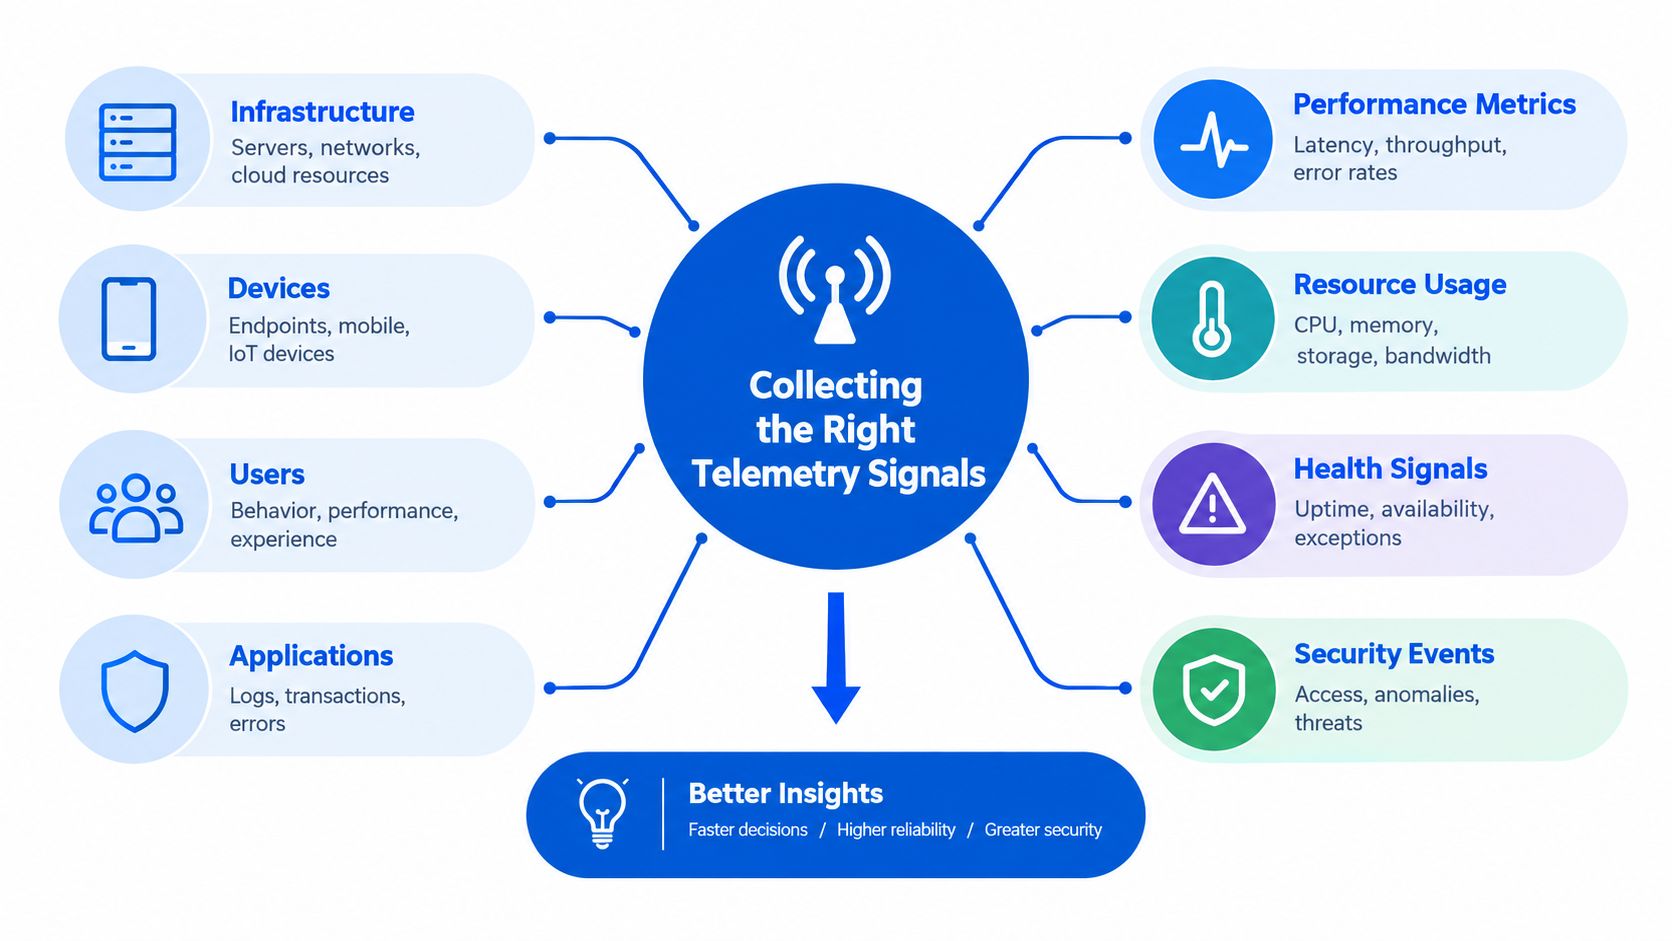
What do you need to retain before botnet detection stops being guesswork? Start with telemetry you can query later under pressure: DNS at the resolver, flow records at the network edge, and application events tied to the action that matters. Each layer fills a different blind spot, especially once payload visibility drops behind encryption.
Capture DNS behavior at the resolver
At the DNS layer, the job is not to restate theory. It is to keep the fields you will wish you had during triage. For each client, retain the queried domain, response type, timestamps, returned answers, TTLs, and the authoritative domain when your resolver exposes it. From there, derive NXDOMAIN ratios, unique-domain counts, query bursts, recurrence, and naming patterns that do not fit the host's baseline.
Retention quality matters as much as feature choice. If all activity is flattened behind a shared NAT address, analysts lose the client-level thread and the pattern gets washed out. In practice, recurring failed lookups often become more useful when paired with client identity, time window, and domain churn than when viewed as a raw count across the whole network.
Add flow metadata, not just packets
Packet capture is expensive to keep and often disappointing once traffic is encrypted. NetFlow or IPFIX usually gives a better operational return because it preserves connection metadata you can store longer and query faster. Collect source and destination, ports, start and end times, packet and byte counts, and flow duration. Those fields are enough to surface repeated short flows, unusual fan-out, synchronized outbound sessions, and destinations that are rare for a given host.
Sensor placement matters here. In cloud and distributed environments, teams regularly discover they have visibility on ingress but almost none on outbound paths that matter for command-and-control traffic. Use a clear guide to ingress and egress traffic when mapping where telemetry is collected, which paths are sampled, and how long raw records survive before rollup.
Application telemetry belongs in the same collection plan. Logging authentication outcomes, request timing, session state, origin context, and browser or device signals helps teams investigating abuse that crosses the network edge and the app boundary. The same discipline improves securing your social data APIs, where an attacker can look normal at the transport layer while still automating high-value actions.
Preserve application context
Keep the action context that makes infrastructure signals usable. Record the account identifier in a protected form, the authentication result, session state, request timing, device or browser signals, and the operation being attempted. Do not store plaintext passwords.
For signups, retain registration velocity and reuse patterns. For checkout, keep the order of cart, payment, and confirmation requests. Normalize features by host and time window so a laptop, server, mobile device, and shared office network are not judged by the same raw counts. That is what lets a team separate ordinary software noise from coordinated behavior that deserves investigation.
Correlating Indicators for Detection
What turns a noisy signal into a case worth waking someone up for? Correlation does. One strange DNS pattern is often harmless. One odd outbound session can be a backup job, an updater, or a brittle internal tool. The case gets stronger when the same host, or a related set of hosts, lines up across DNS, flow, and application telemetry inside the same window.
The workflow matters more than any single indicator. Start by grouping events by asset type, user or account context where available, destination, and short time window. Then score combinations instead of isolated events. A laptop resolving a rare domain is weak evidence. A laptop resolving that domain, opening short encrypted sessions to an uncommon destination, and then attempting a burst of login actions is a different story. That is how you close the gap created by encrypted traffic. You cannot read the payload, so you verify the pattern around it.
A practical correlation model usually asks four questions:
- Does the infrastructure behavior depart from this asset's normal pattern?
- Do multiple hosts or accounts show the same change at roughly the same time?
- Does the destination or domain relationship look unusual for the service involved?
- Does the application layer show a high-value action that makes the network signal matter?
That last question is where many teams still fall short. Network telemetry can tell you that several devices are reaching new infrastructure with suspicious timing. It cannot tell you whether those same devices are only browsing, or trying to take over accounts, drain gift-card balances, or automate signup abuse. Application telemetry answers that part. Browser verification adds another check. If the network signals look wrong but the request carries fresh browser proof from a real client, the response can be a step-up challenge or closer review instead of a blanket block. MANDATE-style verification is useful here because it lets teams confirm browser presence on sensitive actions without dropping a CAPTCHA on every borderline request.
Baseline quality decides whether correlation helps or just creates a bigger queue. Compare hosts to peers that resemble them. Build servers, employee laptops, mobile clients, kiosks, and payment services should not share one threshold set. I have seen teams bury themselves by tuning on global counts. The fix is boring but effective: normalize by asset class, environment, and time period, then tune the joined signals.
DNS tunneling is a good example. The useful path is not to restate that high entropy or odd labels can be suspicious. It is to join those DNS features with communication volume, recurrence, destination history, and the absence of any business reason for that host to use the domain. The DNS tunneling study gives a concrete starting point. Its enterprise evaluation found that more than 4 kB/day of surreptitious communication was a workable threshold for analyst review. Treat that as an initial yardstick, not policy. Some legitimate services are noisy, and some quiet tunnels stay under obvious thresholds.
The same discipline applies to encrypted sessions. TLS hides content, not timing, destination changes, retry patterns, fan-out, or the relationship between a DNS lookup and the connection that follows. If several hosts begin reaching a new set of endpoints with similar cadence, and the related accounts start failing login checks or pushing high-risk actions, raise the score. Keep the decision path explainable. Analysts should be able to see which signals came from DNS, which came from flows, and which came from the app or browser layer.
For teams building that process, the Sift AI suspicious activity guide is a useful reference on treating suspicious behavior as a pattern instead of a single event. That is the operational goal here. Join weak clues until they become actionable, then verify before you block.
Tooling and Automation Strategies
Manual packet review doesn't scale. The practical architecture is a pipeline that ingests DNS and flow records, normalizes them, enriches destinations, calculates features, and sends only correlated cases to analysts or enforcement systems.
Open-source network sensors can provide DNS and flow visibility, while a SIEM or stream-processing layer can join records by client, asset, domain, and time window. Commercial threat-intelligence platforms can add reputation and infrastructure context. The choice matters less than retaining raw evidence and making the resulting decisions reviewable.
Compare the layers by job
| Layer | Strong at | Weak at |
|---|---|---|
| DNS analytics | Domain churn, NXDOMAIN patterns, client coordination | Identifying the exact user behind a request |
| Flow monitoring | Periodicity, fan-out, destination changes, encrypted-session metadata | Explaining the business action being attempted |
| Application telemetry | Login, signup, checkout, and session behavior | Seeing unrelated device activity outside the service |
| Browser verification | Checking whether a request has fresh browser proof | Replacing network monitoring for command-and-control |
A layered design avoids forcing one tool to solve every problem. Network monitoring can identify a potentially compromised host. Application telemetry can show that the same infrastructure is attempting account actions. Browser verification can add evidence at the point where an organization decides whether to process a high-value request.
Automate carefully
Automate collection, feature calculation, enrichment, alert routing, and evidence preservation. Keep escalation and enforcement explainable. Rules should show the observations behind a decision, such as increased failed lookups combined with synchronized outbound flows and repeated login attempts.
Detection performance varies significantly by dataset and environment. In one passive-DNS prototype, a Naive Bayes classifier reached 65% overall classification accuracy, correctly labeling 44 of 50 benign captures while misclassifying 6 as malicious. A later DNS-fingerprinting study evaluated 467 million DNS queries from a university network and reported that DNSMiner achieved up to a 91% user-detection rate with a false-positive rate below 1.3%. The same work described another rule-based system reaching 99.35% accuracy with a 0.25% false-positive rate, as reported in the DNS fingerprinting study.
Those figures aren't interchangeable production promises. Dataset composition, validation windows, class imbalance, and network design change the result. An evaluation of layered flow and DNS systems reported BotMiner-style detection rates from 75% to 100%, while one NetFlow study reported up to 97% detection with a 3% false-positive rate. A DNS-failure method reported false positives as low as 0.02% in its evaluated datasets. The flow and DNS detection report makes the operational point clear: benchmark accuracy isn't the same as production capability.
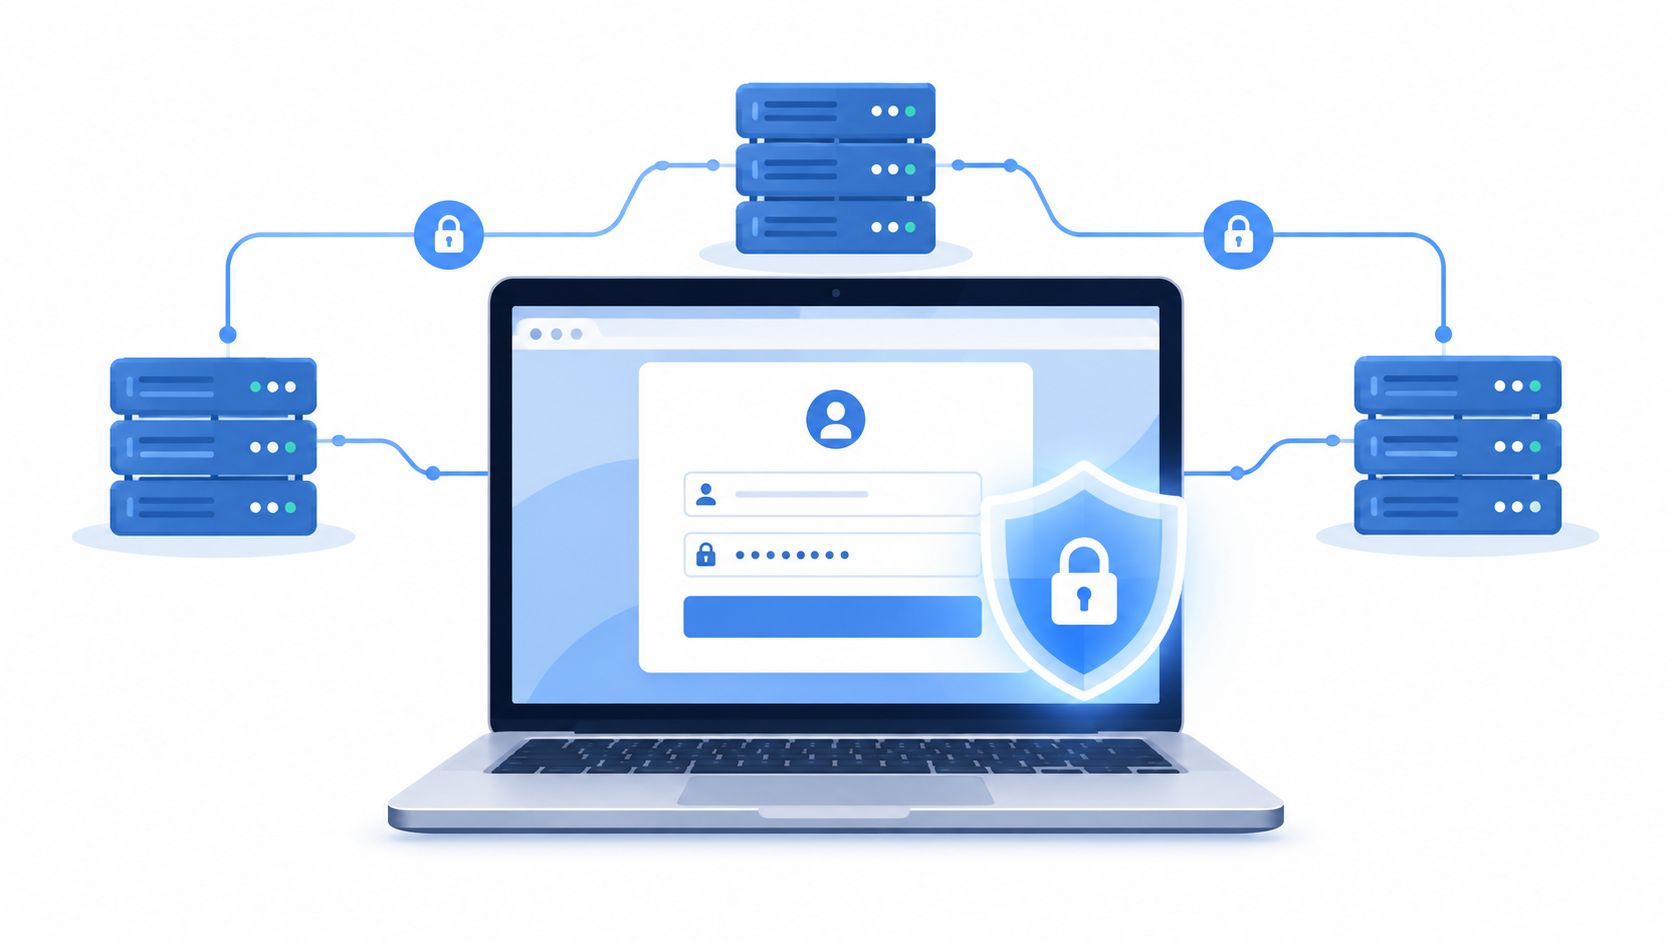
For high-value web actions, MANDATE provides invisible browser verification to distinguish legitimate users from automated abuse by collecting browser proof and validating it on the server without user-facing friction. You can review the product's integration model in bot detection software guidance.
Integrating Invisible Browser Verification
Network detection tells you that a host or group of hosts looks suspicious. It doesn't, by itself, decide whether a specific login, signup, or checkout should proceed. That decision belongs close to the application action, where you can combine browser proof with account, session, request, and network context.
Start with observation
Instrument the browser flow so the client can collect proof, then send the relevant request through server-side verification. Keep the initial result in Observe mode. Record the decision, action, account context, network signals, and downstream outcome without blocking the user.
This period exposes integration errors and false positives before they affect conversion. Compare verification outcomes with your existing signals. A request with unusual DNS history but valid, fresh browser proof may deserve review rather than an immediate denial. A request with suspicious infrastructure, rapid account enumeration, and failed browser verification is a stronger enforcement candidate.

Bind decisions to the action
Use verification where the risk is concentrated. A public content page usually doesn't need the same treatment as password reset, login, signup, checkout, or ticket purchase. At the server, combine browser verification with:
- Account context: Is one account receiving repeated attempts, or are many accounts being tested?
- Session context: Does the request belong to a coherent session?
- Network evidence: Does the originating environment match known suspicious DNS or flow activity?
- Request behavior: Is the client moving through the expected workflow or replaying isolated calls?
OWASP separates credential cracking from credential stuffing. Cracking tries different usernames or passwords to find valid credentials, while stuffing tests username and password pairs stolen from another service. OWASP classifies credential stuffing as OAT-008 and recommends treating it as a distinct automated threat in its Bot Management and Anti-Automation Cheat Sheet.
Enforce proportionately
Don't turn every failed verification into a hard block. Use outcomes such as allow, flag, slow, or block according to action risk and confidence. Review decisions in a dashboard, preserve evidence, and tune policies against real outcomes.
Invisible browser verification should complement, not replace, network analytics. It helps answer whether a request has fresh browser proof at the application boundary. DNS and flow monitoring helps answer whether the surrounding infrastructure behaves like coordinated command-and-control traffic.
The anti-bot verification overview describes this server-verified approach without putting a CAPTCHA or puzzle in the standard user path. No verification layer guarantees that every automated request will be stopped, so keep independent controls and incident response procedures in place.
Key Takeaways for Security Teams
The reliable answer to how to detect botnet activity is layered and operational:
- Collect broadly: DNS, flow metadata, and application logs reveal different parts of the attack.
- Correlate carefully: NXDOMAIN bursts, domain churn, synchronized flows, and abusive account actions are stronger together than alone.
- Respect encryption: Metadata and timing still matter when payloads are hidden, but periodic traffic isn't proof of compromise.
- Validate realistically: Test across time, environments, and unseen behavior. Track false positives and analyst workload, not accuracy alone.
- Stage enforcement: Begin in Observe mode, preserve evidence, review outcomes, and escalate only when independent signals agree.
- Protect the action: Add server-verified browser evidence at login, signup, checkout, and other sensitive endpoints.
Network visibility finds infrastructure patterns. Application telemetry explains business impact. Invisible browser verification adds a decision signal at the request boundary. Together, they let teams reduce automated abuse without treating every unusual user or residential network as hostile.
MANDATE offers invisible browser verification for important website actions, collecting browser proof and validating it on the server without CAPTCHAs or user-facing puzzles. Use it alongside DNS, flow, and application telemetry, begin with observation, and visit MANDATE to review the available integration options.